INSTANT INSIGHTS WITH HEATMAPS
Visualise AR & VR User Activity
Anonymous data tracking – GDPR Compliant
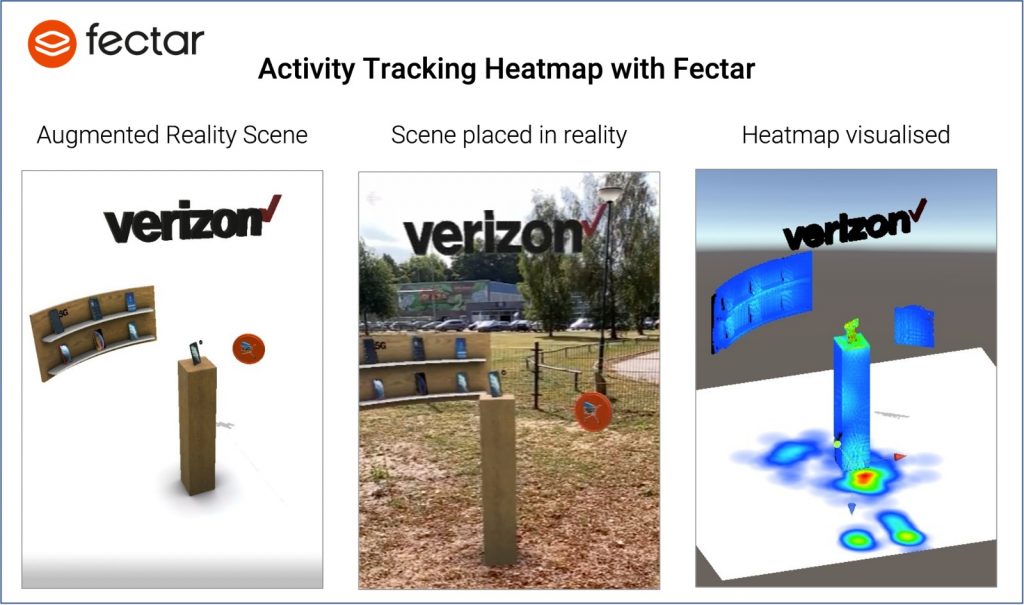
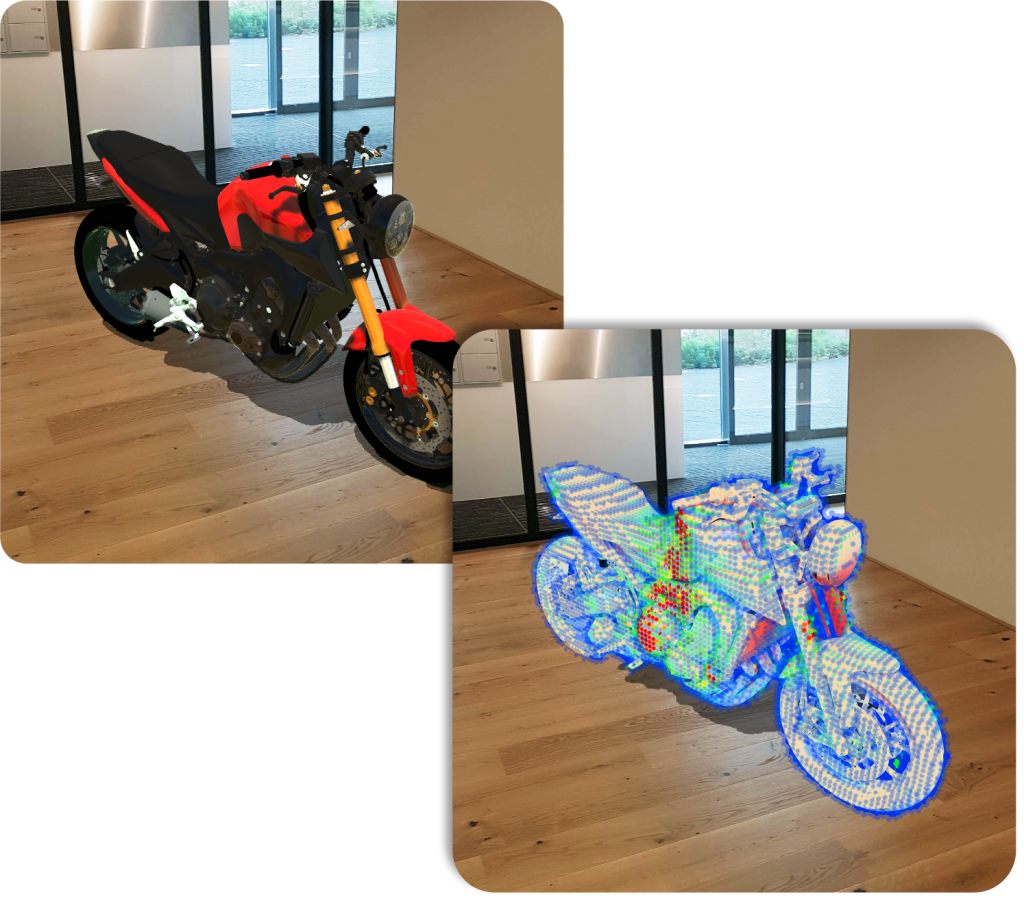
For 3D environments metric data alone is insufficient. Spatial data is required to fully understand the journey of a user through a 3D AR scene. Movement through the environment and directional data provide relevant information on user behavior.
Data visualization is a central tool for the initial analysis of behavioral data. A heatmap is one of the commonly used techniques to directly visualize data.
Visualise Data of Users in AR & VR and use our database with more than 8 million AR & VR sessions to benchmark your creations. You visualise a heatmap in AR or VR for:
So with the rapid growth of VR and AR implementation in an increasing number of areas the diversity and pace of data acquisition is accelerating. Integrated spatial data visualization in the form of heatmaps allows you to bridge the gap between data acquisition and gathering insight from this data.
With specific analytics tools, like the patented Fectar Heatmaps, you add a whole new dimension to your 3D AR world.